Monitoring The Memory of Suspicious Processes
If you are operating many GNU/Linux boxes, it's not uncommon to have issues with some processes leaking memory. It's often the case for long-running processes handling large amount of data and usually using small chunk of memory segment while not freeing them back to the operating system. If you played with the Python "gc.garbage" or abused the Perl Scalar::Util::weaken function but to reach that stage, you need to know which processes ate the memory.
Usually looking for processes eating the memory, you need to have a look at the running process using ps, sar, top, htop… For a first look without installing any additional software, you can use ps with its sorting functionality:
%ps -eawwo size,pid,user,command --sort -size | head -20
 SIZE   PID USER     COMMAND
224348 32265 www-data /usr/sbin/apache2 -k start
224340 32264 www-data /usr/sbin/apache2 -k start
162444  944 syslog   rsyslogd -c4
106000 2229 datas     redis-server /etc/redis/redis.conf
56724 31034 datap    perl ../../pdns/parse.pl
32660  3378 adulau   perl pdns-web.pl daemon --reload
27040  4400 adulau   SCREEN
20296 20052 unbound  /usr/sbin/unbound
...
It's nice to have a sorted list by size but usually the common questions are:
- Is that normal?
- What's the evolution over time?
- Does the value increased or reduced over time?
- Which memory usage is evolving badly?
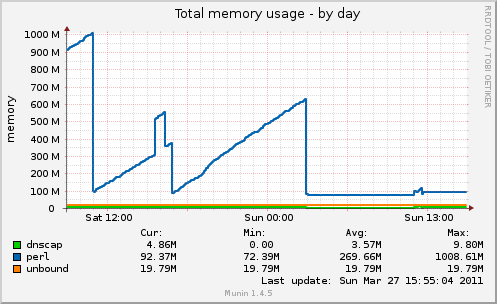
My first guess was to get the values above in a file, add a timestamp in front and make a simple awk script to display the evolution and graph it. But before jumping into it, I checked in Munin if there is a default plugin to do that per process. But there is no default plugin… I found one called multimemory that basically doing that per process. To configure it, you just need to add it as plugin with the processes you want to monitor.
[multimemory]
env.os linux
env.names apache2 perl unbound rsyslogd
If you want to test the plugin, you can use:
%munin-run multimemory
perl.value 104148992
unbound.value 19943424
rsyslogd.value 162444
apache2.value 550055
You can connect to your Munin web page and you'll see the evolution for each monitored process name. After that's just a matter of digging into "valgrind --leak-check=full" or use your favorite profiling tool for Perl, Ruby or Python.
Tags: unix command-line memory monitoring


